
VIG shares traded in the range of EUR 37.500 to EUR 39.000 during the first two months of 2013. This trend was followed by a significant upward breakout at the beginning of March. VIG share movements were volatile in the 2nd quarter and, similar to the ATX index, led to a low for the year of EUR 34.260 on 24 June 2013 due to developments in the international market. It was not until the beginning of the 3rd quarter that VIG shares recorded an upswing, analogous to the ATX index, that raised them to a high for the year of EUR 42.810 on 16 August. A downward trend began already on the following day, taking the share price almost back down to the low for the year on 5 December. This trend ended at a price of EUR 34.600 and the shares then attempted to recover part of their losses by the end of the year. VIG shares closed 2013 at a price of EUR 36.225 on the Vienna Stock Exchange, representing performance of minus 10.3% for the year. As of the editorial deadline, the shares were trading at EUR 36,065.
VIG share movements on the Prague Stock Exchange were just as volatile as in Vienna during the course of 2013. Closing prices remained in a range between CZK 940.00 and CZK 1,060.00 until the end of the 2nd quarter, followed by a downward movement to a low for the year of CZK 893.00, reached on the same date as the quotation in Vienna. In the 3rd quarter, VIG shares began an upward trend that reached a high of CZK 1,091.00 on 13 August. VIG shares closed 2013 at a price of CZK 990.00 on the Prague Stock Exchange to record negative performance of 1.0% for the year. On the editorial deadline, the shares had reached a value of CZK 990,00.
Vienna Insurance Group (VIG) compared to the ATX and MSCI insurance index (in EUR) January 2013 to February 2014
 compared to the ATX and MSCI insurance index (in EUR) (line chart)")
| XLS Download |
|
Overview of VIG shares |
|
|
Initial listing (Vienna) |
17 October 1994 |
|
Initial listing (Prague) |
5 February 2008 |
|
Number of common shares |
128 mn |
|
Free float |
approx 30% |
|
ISIN |
AT0000908504 |
|
Securities symbol |
VIG |
|
Bloomberg |
VIG AV / VIG CP |
|
Reuters |
VIGR.VI / VIGR.PR |
|
Rating – Standard & Poor’s |
A+, stable outlook |
| XLS Download |
|
Key share information |
|
2013 |
2012 |
2011 |
||||
|
||||||||
|
Market capitalisation |
EUR million |
4,636.80 |
5,168.00 |
3,919.36 |
||||
|
Average number of shares traded per day |
Units |
approx. 64,000 |
approx. 76,000 |
approx. 101,000 |
||||
|
Average daily stock exchange trading volume (single counting) |
EUR million |
3.0 |
3.2 |
4.2 |
||||
|
Year-end price |
EUR |
36.225 |
40.375 |
30.620 |
||||
|
High |
EUR |
42.810 |
40.375 |
43.650 |
||||
|
Low |
EUR |
34.260 |
27.630 |
24.625 |
||||
|
Share performance for the year (excluding dividends) |
% |
-10.28 |
31.86 |
-21.29 |
||||
|
Dividend per share1) |
EUR |
1.30 |
1.20 |
1.10 |
||||
|
Dividend yield |
% |
3.59 |
2.97 |
3.59 |
||||
|
Earnings per share2) |
EUR |
1.57 |
3.01 |
2.87 |
||||
|
Price-earnings ratio as of 31 December |
|
23.08 |
13.41 |
10.69 |
||||
Shareholder structure of VIG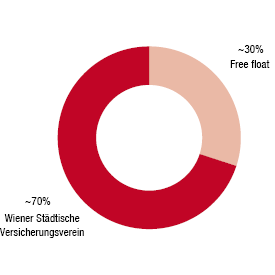 |
Geographical distribution of free float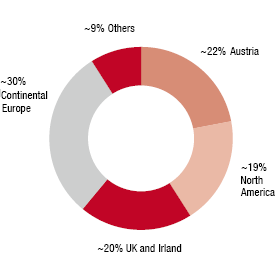 |