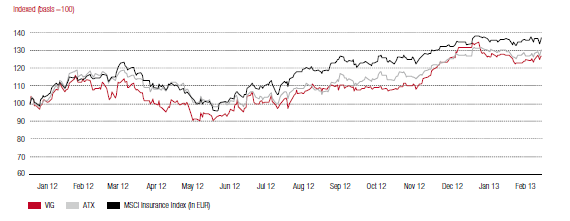
Due to market uncertainty resulting from the European debt crisis, the performance of VIG shares on the Vienna Stock Exchange was mixed in the first three quarters of 2012. Similar to the Euro STOXX Insurance Index, the price of VIG shares recorded their low for the year on 1 June 2012. It was not until the final weeks of 2012 that the Company's shares were able to gain ground again compared to the MSCI Insurance Index and Euro STOXX Insurance Index. From September to the middle of November 2012, VIG shares oscillated around a value of EUR 33.50 and then finally broke out of the sideways trend to follow a sharp upward trend. The price at the end of the year was EUR 40.38, which corresponds to an increase of 22.4% compared to the end of the 3rd quarter. With annual performance of +31.9%, VIG shares outperformed the ATX by more than 18%. As of the editorial deadline, the shares were trading at EUR 38.79.
Performance of the VIG shares listed on the Prague Stock Exchange was almost identical to those on the Vienna Stock Exchange. They closed 2012 at exactly CZK 1,000.00, corresponding to an annual performance of 25.0%. This means that VIG shares outperformed the PX (leading index of the Prague Stock Exchange) by more than 10 percentage points. As of the editorial deadline, the shares had reached a value of CZK 991,50 at the end of February.
Vienna Insurance Group (VIG) compared to the ATX and MSCI insurance index (in EUR) January 2012 to February 2013
| XLS Download |
|
Overview of VIG shares | |
|
Initial listing (Vienna) |
17 October 1994 |
|
Initial listing (Prague) |
5 February 2008 |
|
Number of common shares |
128 million |
|
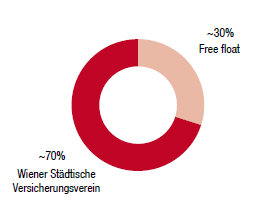
Free floating |
approx 30% |
|
ISIN |
AT0000908504 |
|
Securities symbol |
VIG |
|
Bloomberg |
VIG AV / VIG CP |
|
Reuters |
VIGR.VI / VIGR.PR |
|
Rating – Standard & Poor’s |
A+, stable outlook |
| XLS Download |
|
Key share information |
|
2012 |
2011 |
2010 | ||||
| ||||||||
|
Market capitalisation |
EUR million |
5,168.64 |
3,919.36 |
4,979.20 | ||||
|
Average number of shares traded per day |
Units |
approx. 76,000 |
approx. 101,000 |
approx. 100,000 | ||||
|
Average daily stock exchange trading volume (single counting) |
EUR million |
3.2 |
4.2 |
4.5 | ||||
|
Year-end price |
EUR |
40.38 |
30.62 |
38.90 | ||||
|
High |
EUR |
40.38 |
43.65 |
40.97 | ||||
|
Low |
EUR |
27.63 |
24.63 |
30.84 | ||||
|
Share performance for the year (excluding dividends) |
% |
31.86 |
-21.29 |
8.06 | ||||
|
Dividend per share1) |
EUR |
1.20 |
1.10 |
1.00 | ||||
|
Dividend yield |
% |
2.97 |
3.59 |
2.57 | ||||
|
Earnings per share2) |
EUR |
3.17 |
2.87 |
2.65 | ||||
|
Price-earnings ratio as of 31 December |
|
12.74 |
10.69 |
14.66 | ||||
Shareholder structure of VIG
|
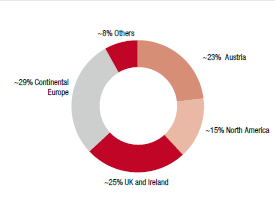
Geographical distribution of free float |