| XLS Download |
|
|
|
2010 |
2011 |
2012 | ||||||
|
Income statement* |
|
|
|
| ||||||
| ||||||||||
|
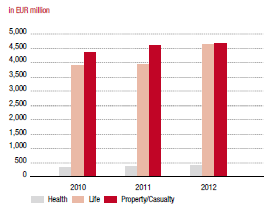
Premiums written |
EUR millions |
8,593.01 |
8,883.67 |
9,685.67 | ||||||
|
Property/Casualty insurance |
EUR millions |
4,350.04 |
4,579.30 |
4,673.44 | ||||||
|
Life insurance |
EUR millions |
3,904.81 |
3,944.22 |
4,620.72 | ||||||
|
Health insurance |
EUR millions |
338.16 |
360.15 |
391.51 | ||||||
|
Premiums written* |
EUR millions |
8,593.01 |
8,883.67 |
9,685.67 | ||||||
|
Austria |
EUR millions |
4,049.30 |
4,037.50 |
4,122.53 | ||||||
|
Czech Republic |
EUR millions |
1,725.07 |
1,823.89 |
1,795.58 | ||||||
|
Slovakia |
EUR millions |
652.79 |
684.26 |
704.11 | ||||||
|
Poland |
EUR millions |
747.91 |
954.22 |
1,611.74 | ||||||
|
Romania |
EUR millions |
532.48 |
503.08 |
448.25 | ||||||
|
Remaining markets |
EUR millions |
871.72 |
857.19 |
975.56 | ||||||
|
Central functions |
EUR millions |
733.75 |
993.67 |
1,341.44 | ||||||
|
Consolidation |
EUR millions |
-720.00 |
-970.15 |
-1,313.53 | ||||||
|
Result from investments |
EUR millions |
1,116.44 |
931.61 |
1,240.52 | ||||||
|
Profit before taxes* |
EUR millions |
507.79 |
559.01 |
587.41 | ||||||
|
Property/Casualty insurance |
EUR millions |
222.72 |
271.51 |
330.48 | ||||||
|
Life insurance |
EUR millions |
248.46 |
239.81 |
225.71 | ||||||
|
Health insurance |
EUR millions |
36.61 |
47.69 |
31.22 | ||||||
|
Profit before taxes |
EUR millions |
507.79 |
559.01 |
587.41 | ||||||
|
Austria |
EUR millions |
292.65 |
291.88 |
295.28 | ||||||
|
Czech Republic |
EUR millions |
152.64 |
187.11 |
194.97 | ||||||
|
Slovakia |
EUR millions |
35.83 |
54.12 |
56.89 | ||||||
|
Poland |
EUR millions |
19.22 |
36.41 |
41.57 | ||||||
|
Romania |
EUR millions |
30.94 |
-12.99 |
-20.45 | ||||||
|
Remaining markets |
EUR millions |
2.15 |
23.15 |
39.13 | ||||||
|
Central functions |
EUR millions |
-25.74 |
-20.49 |
-20.08 | ||||||
|
Consolidation |
EUR millions |
0.09 |
-0.20 |
0.10 | ||||||
|
Net profit for the period after taxes |
EUR millions |
379.75 |
406.75 |
446.19 | ||||||
|
|
|
|
|
| ||||||
|
Balance sheet |
|
|
|
| ||||||
|
Investments |
EUR millions |
33,638.12 |
33,588.18 |
35,906.59 | ||||||
|
Shareholders' equity |
EUR millions |
5,029.65 |
5,049.64 |
5,751.87 | ||||||
|
Underwriting provisions |
EUR millions |
29,245.77 |
29,321.92 |
32,060.89 | ||||||
|
Total assets |
EUR millions |
39,472.92 |
39,769.65 |
42,336.39 | ||||||
|
|
|
|
|
| ||||||
|
Share |
|
|
|
| ||||||
|
Number of shares |
Units |
128,000,000 |
128,000,000 |
128,000,000 | ||||||
|
Market capitalisation |
EUR millions |
4,979.20 |
3,919.36 |
5,168.64 | ||||||
|
Average number of shares traded by day |
Units |
~ 100,000 |
~ 101,000 |
~ 76,000 | ||||||
|
Year-end price |
EUR |
38.90 |
30.62 |
40.38 | ||||||
|
High |
EUR |
40.97 |
43.65 |
40.38 | ||||||
|
Low |
EUR |
30.84 |
24.63 |
27.63 | ||||||
|
Share performance for the year (excluding dividends) |
% |
8.06 |
-21.29 |
31.86 | ||||||
|
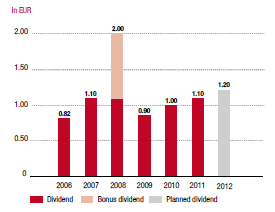
Dividend per share |
EUR |
1.00 |
1.10 |
1.20** | ||||||
|
Dividend yield |
% |
2.57 |
3.59 |
2.97 | ||||||
|
Earnings per share |
EUR |
2.65 |
2.87 |
3.17 | ||||||
|
Price-earnings ratio as of 31 December |
|
14.66 |
10.69 |
12.74 | ||||||
|
|
|
|
|
| ||||||
|
Number of employees |
|
25,006 |
24,902 |
24,086 | ||||||
|
thereof Austria |
|
5,407 |
5,364 |
5,405 | ||||||
|
thereof outside Austria |
|
18,499 |
18,446 |
17,961 | ||||||
|
thereof central functions |
|
1,100 |
1,092 |
720 | ||||||
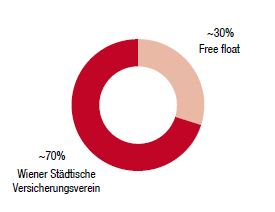
Shareholder structure
|
Development of dividend per share
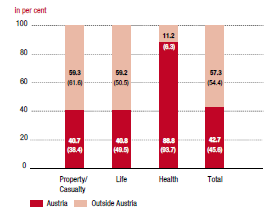
Percentage of premiums by region 2012
|